Expand description
Plotting module for peroxide
For Rust, there are some plot libraries but, still difficult to use. Practically, using python is best choice to plot. And there is awesome crate - pyo3.
§Prerequisite
- python 3
- matplotlib
- scienceplots (Optional)
§Usage
To use this module, you should enable plot feature in Cargo.toml
use peroxide::fuga::*;
fn main() {
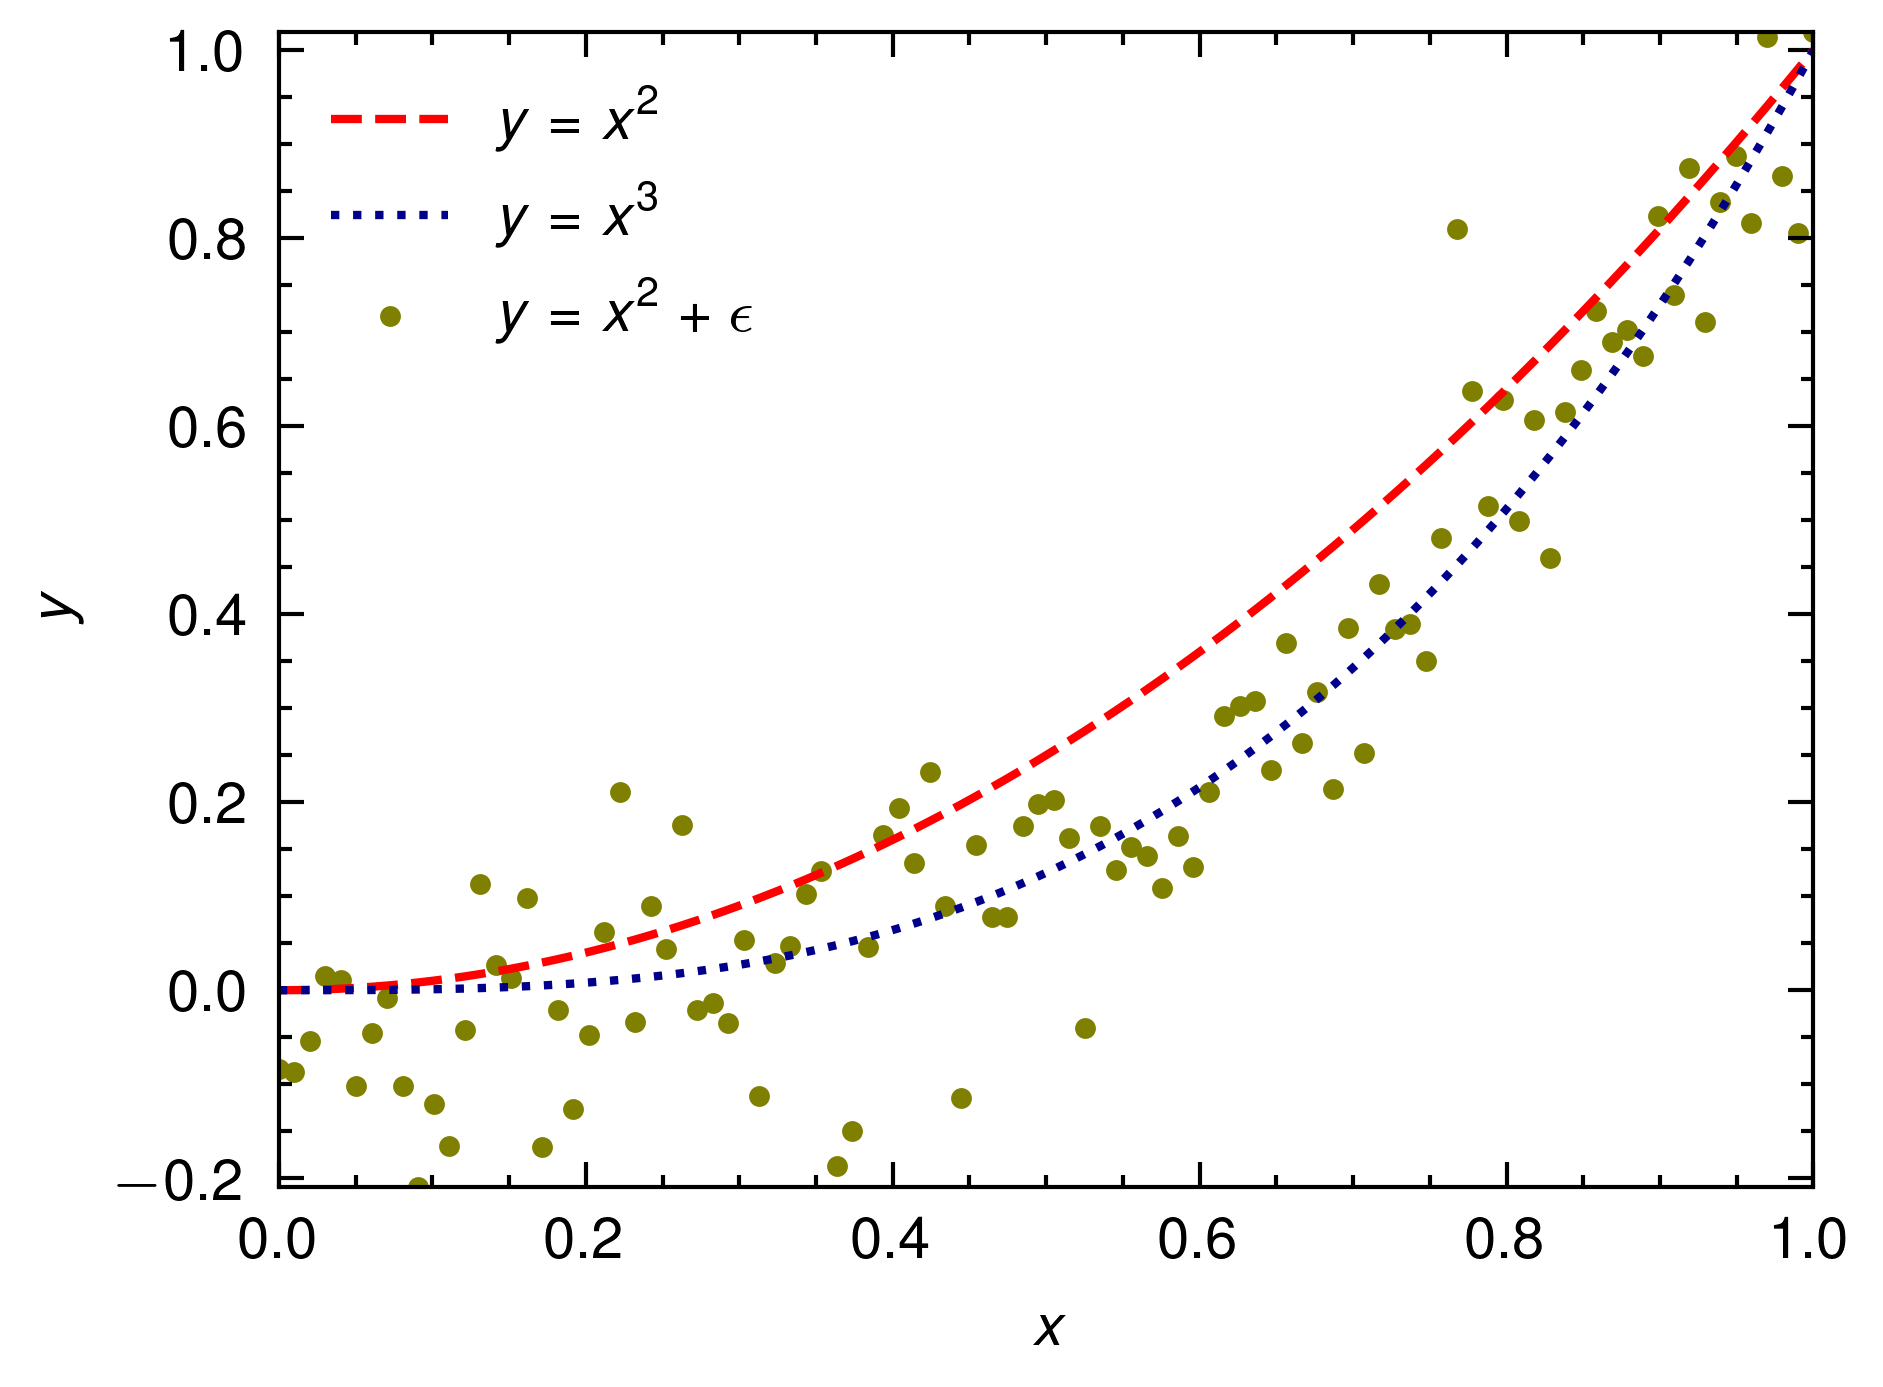
let x = linspace(0, 1, 100);
let y1 = x.fmap(|t| t.powi(2));
let y2 = x.fmap(|t| t.powi(3));
let mut rng = SmallRng::seed_from_u64(42);
let normal = Normal(0f64, 0.1);
let eps = normal.sample_with_rng(&mut rng, x.len());
let y3 = y2.add_v(&eps);
let mut plt = Plot2D::new();
plt.set_domain(x)
.insert_image(y1)
.insert_image(y2)
.insert_image(y3)
.set_legend(vec![r"$y=x^2$", r"$y=x^3$", r"$y=x^2 + \epsilon$"])
.set_line_style(vec![(0, LineStyle::Dashed), (1, LineStyle::Dotted)])
.set_plot_type(vec![(2, PlotType::Scatter)])
.set_marker(vec![(2, Markers::Point)])
.set_color(vec![(0, "red"), (1, "darkblue"), (2, "olive")])
.set_xlabel(r"$x$")
.set_ylabel(r"$y$")
.set_style(PlotStyle::Nature) // if you want to use scienceplots
.set_dpi(600)
.tight_layout()
.set_path("example_data/test_plot.png")
.savefig().unwrap();
}This code will generate below plot
§Available Plot Options
set_domain: Set x datainsert_image: Insert y datainsert_pair: Insert (x, y) dataset_title: Set title of plot (optional)set_xlabel: Set xlabel of plot (optional)set_ylabel: Set ylabel of plot (optional)set_zlabel: Set zlabel of plot (optional; for 3D plot)set_xscale: Set xscale of plot (optional;PlotScale::LinearorPlotScale::Log)set_yscale: Set yscale of plot (optional;PlotScale::LinearorPlotScale::Log)set_xlim: Set xlim of plot (optional)set_ylim: Set ylim of plot (optional)set_legend: Set legend of plot (optional)set_path: Set path of plot (with filename - e.g. “example_data/test_plot.png”)set_fig_size: Set figure size of plot (optional)set_dpi: Set dpi of plot (optional)grid: Set grid of plot (Grid::On, Grid::Off (default))set_marker: Set marker of plot (optional;Markers::{Point, Line, Circle, TriangleUp, ...})set_style: Set style of plot (PlotStyle::Nature,PlotStyle::IEEE,PlotStyle::Default(default),PlotStyle::Science)tight_layout: Set tight layout of plot (optional)set_line_style: Set line style of plot (optional;LineStyle::{Solid, Dashed, Dotted, DashDot})set_color: Set color of plot (optional; Vec<(usize, &str)>)set_alpha: Set alpha of plot (optional; Vec<(usize, f64)>)set_plot_type: Set plot type of plot (optional;PlotType::{Scatter, Line, Bar})savefig: Save plot with given path
Re-exports§
Structs§
Enums§
- Grid
- Line
Style - Markers
- Plot
Options - Plot
Scale - Plot
Style - Plot Style (
scienceplotsshould be installed) - Plot
Type